
Renewables growth fails to oust fossil fuels as France alone hits transition target - Energy Institute

Most big energy users now burn less energy per dollar of output, but global fossil fuel use is still up 8% since 2017, the Energy Institute said on November 10.
Since 2017, 83% of the countries covered by the Institute's Country Transition Tracker have cut the energy intensity of their economies and 86% have lowered the carbon intensity of the energy they consume. Over the same period fossil fuel use rose by 40 exajoules (EJ), with natural gas demand up by nearly 15%, coal by 7% and oil by 5%, while energy-related greenhouse gas emissions grew by nearly 1% a year on average between 2017 and 2025.
The tracker, published on Energy Day at the COP31 climate summit, shows clean energy being added on top of fossil fuels, which are still growing. Renewables have grown faster than fossil fuels for years, yet the world burns more coal, oil and gas than it did in 2017, and fossil fuels supplied more than 85% of the energy consumed worldwide in 2025, according to the Institute's Statistical Review of World Energy published in June.
"The message from this year's Country Transition Tracker is that there is no single global energy transition moving at one speed. Progress is real, particularly on energy efficiency, carbon intensity and the growth of renewable energy, but it is uneven between countries and between different parts of the energy system," said Gemma Regniez, the Energy Institute's director of external affairs.
The tracker draws on the Statistical Review to assess around 80 of the world's largest energy-consuming countries, which account for more than 96% of global energy consumption and 95% of emissions. It scores them on eight measures: energy-related greenhouse gas emissions, fossil fuel consumption, renewable energy consumption, power sector decarbonisation, the carbon intensity of the energy system, energy consumption per capita, economy-wide energy intensity and economy-wide carbon intensity.
Efficiency is the one broad win
Energy intensity, the amount of energy needed to produce a dollar of GDP, is where the progress is most widespread. Hydrocarbon producers dominate the bottom of the table. Trinidad and Tobago, whose economy is built around gas-based petrochemicals and LNG, used about 15 megajoules per dollar of GDP in 2025, followed by Iceland at about 13, Turkmenistan at about 12.5 and Venezuela at about 11.5. Oman, Kuwait, Iran, Qatar, Russia and the UAE make up the rest of the ten most energy-intensive economies, with Russia at about 7.2 megajoules per dollar and the UAE at about 6.9.
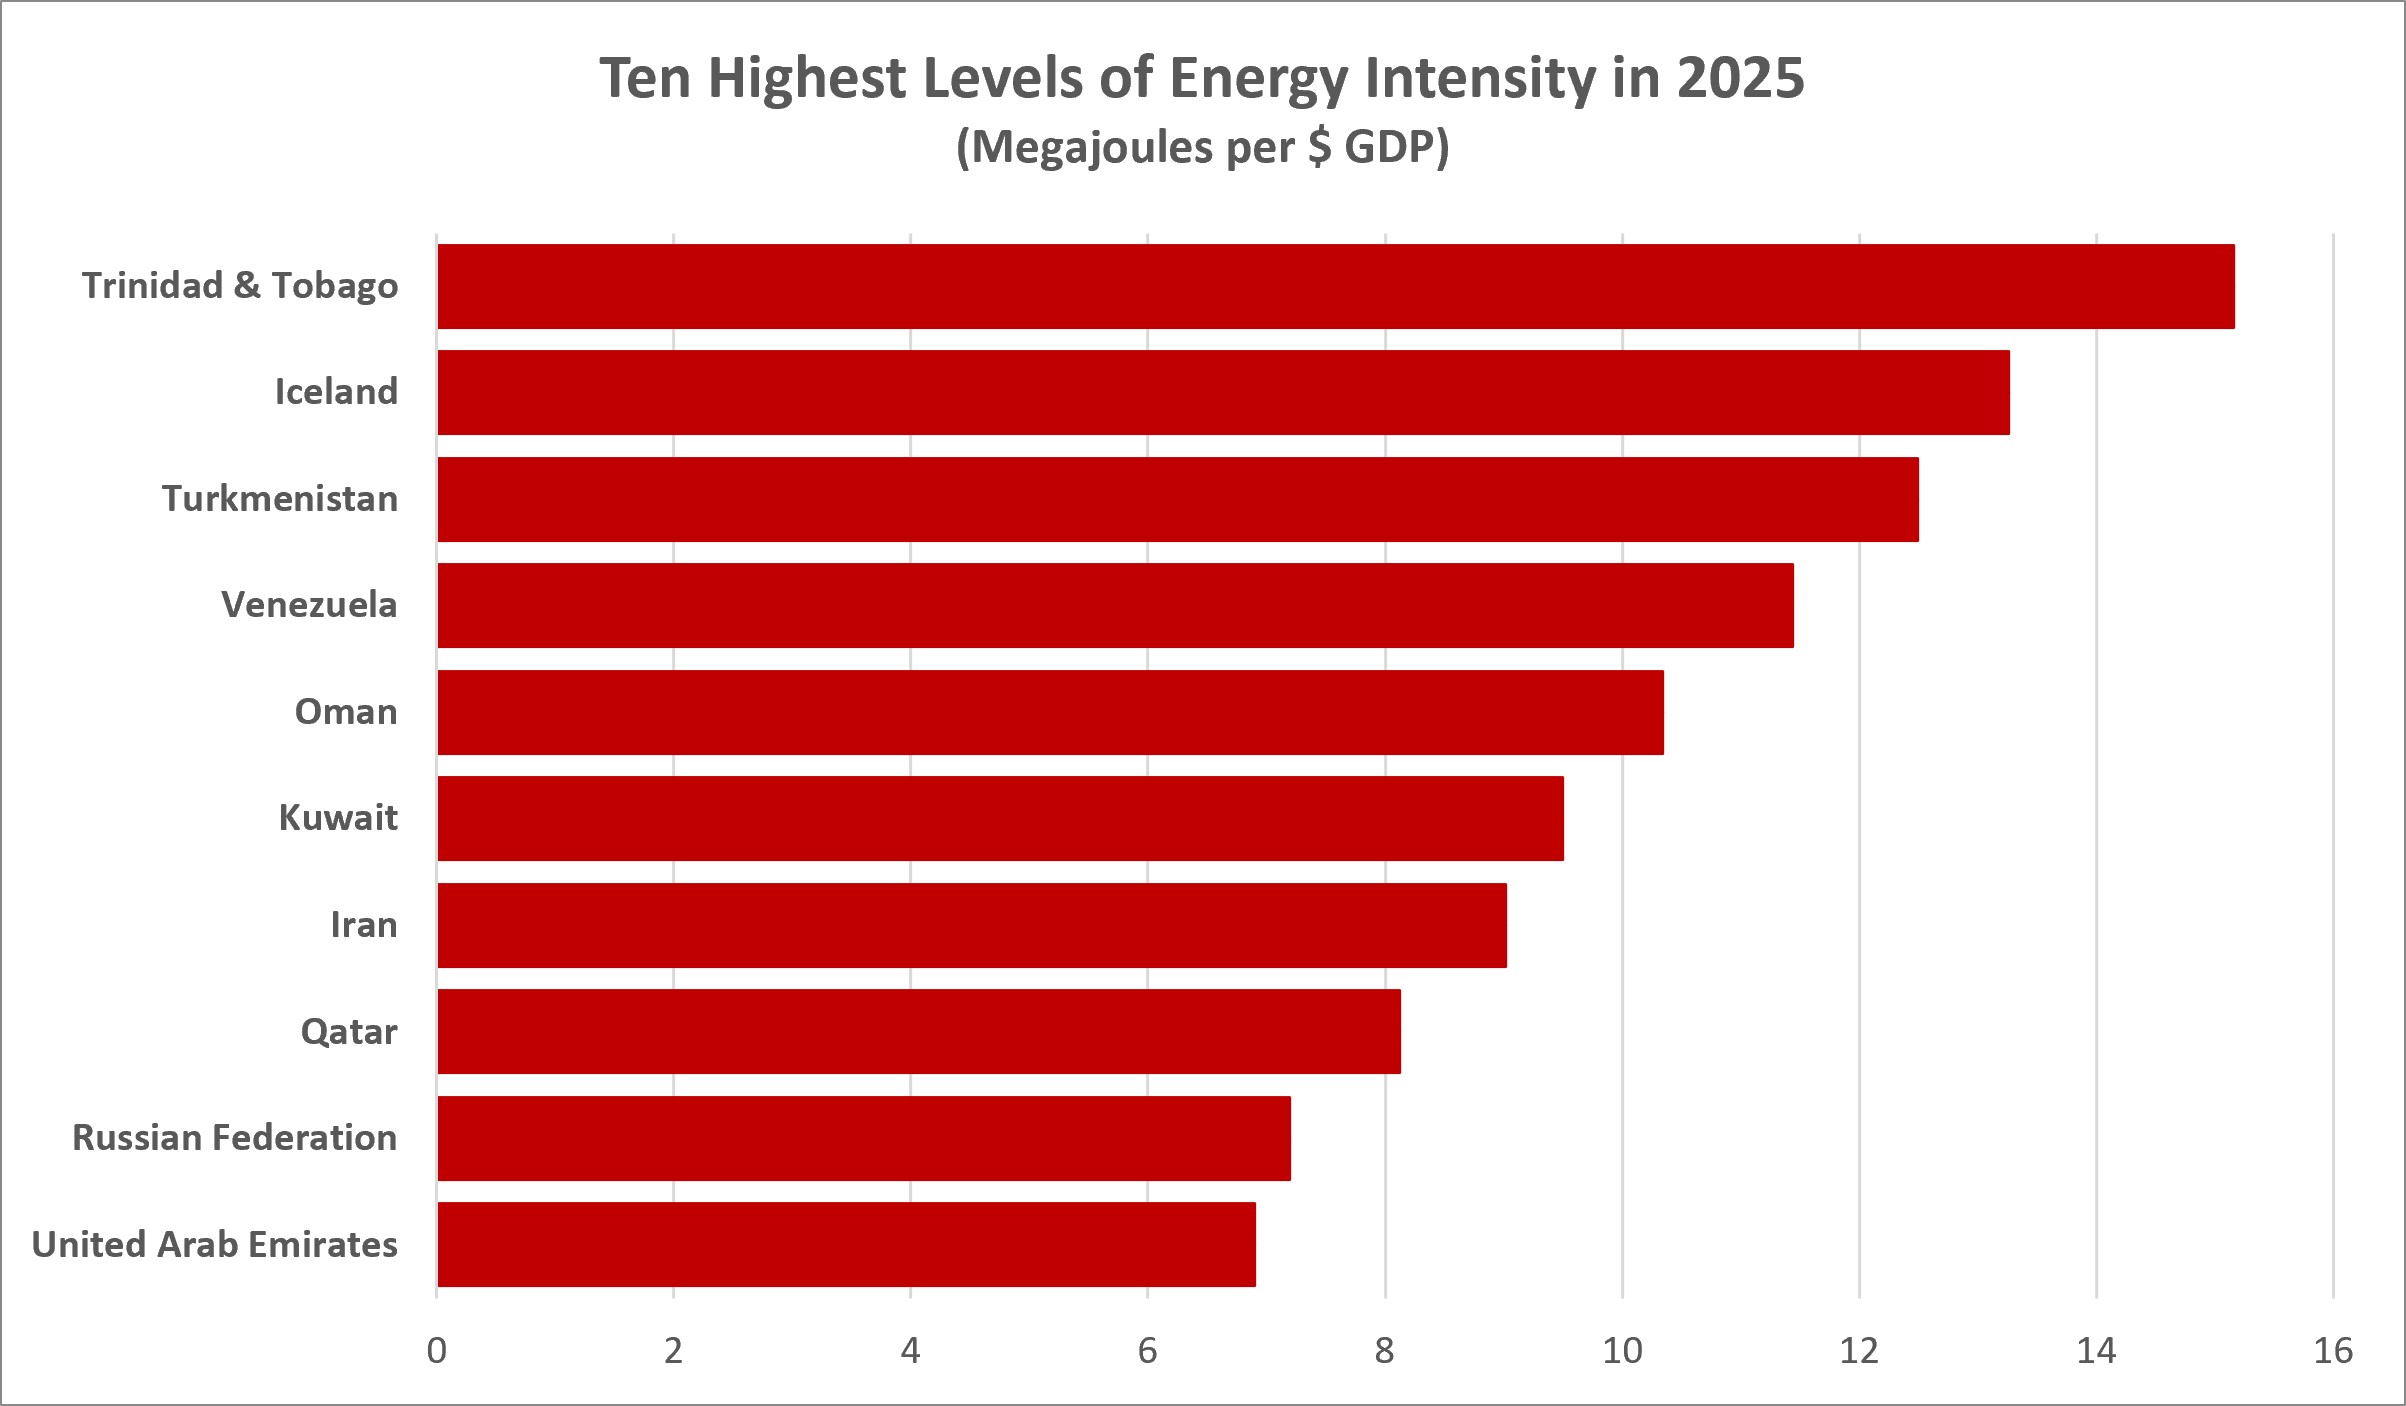
The ten most energy-intensive economies in 2025, in megajoules per dollar of GDP. Source: Energy Institute Statistical Review of World Energy Country Transition Tracker
Iceland is the outlier on that list: its energy is almost entirely renewable, but it runs energy-hungry aluminium smelters on cheap geothermal and hydro power, which pushes up its use of energy per unit of output.
At the other end, Ireland is the least energy-intensive economy at under 1 megajoule per dollar, ahead of Sri Lanka, Switzerland and Denmark, all at under 1.5. Bangladesh, Luxembourg, Romania, Lithuania, the UK and Portugal complete the ten, all at about 2 megajoules per dollar or less. Ireland's figure is flattered by the profits that multinational companies book there, which inflate its GDP, and several of the European names on the list have long since moved heavy industry offshore.
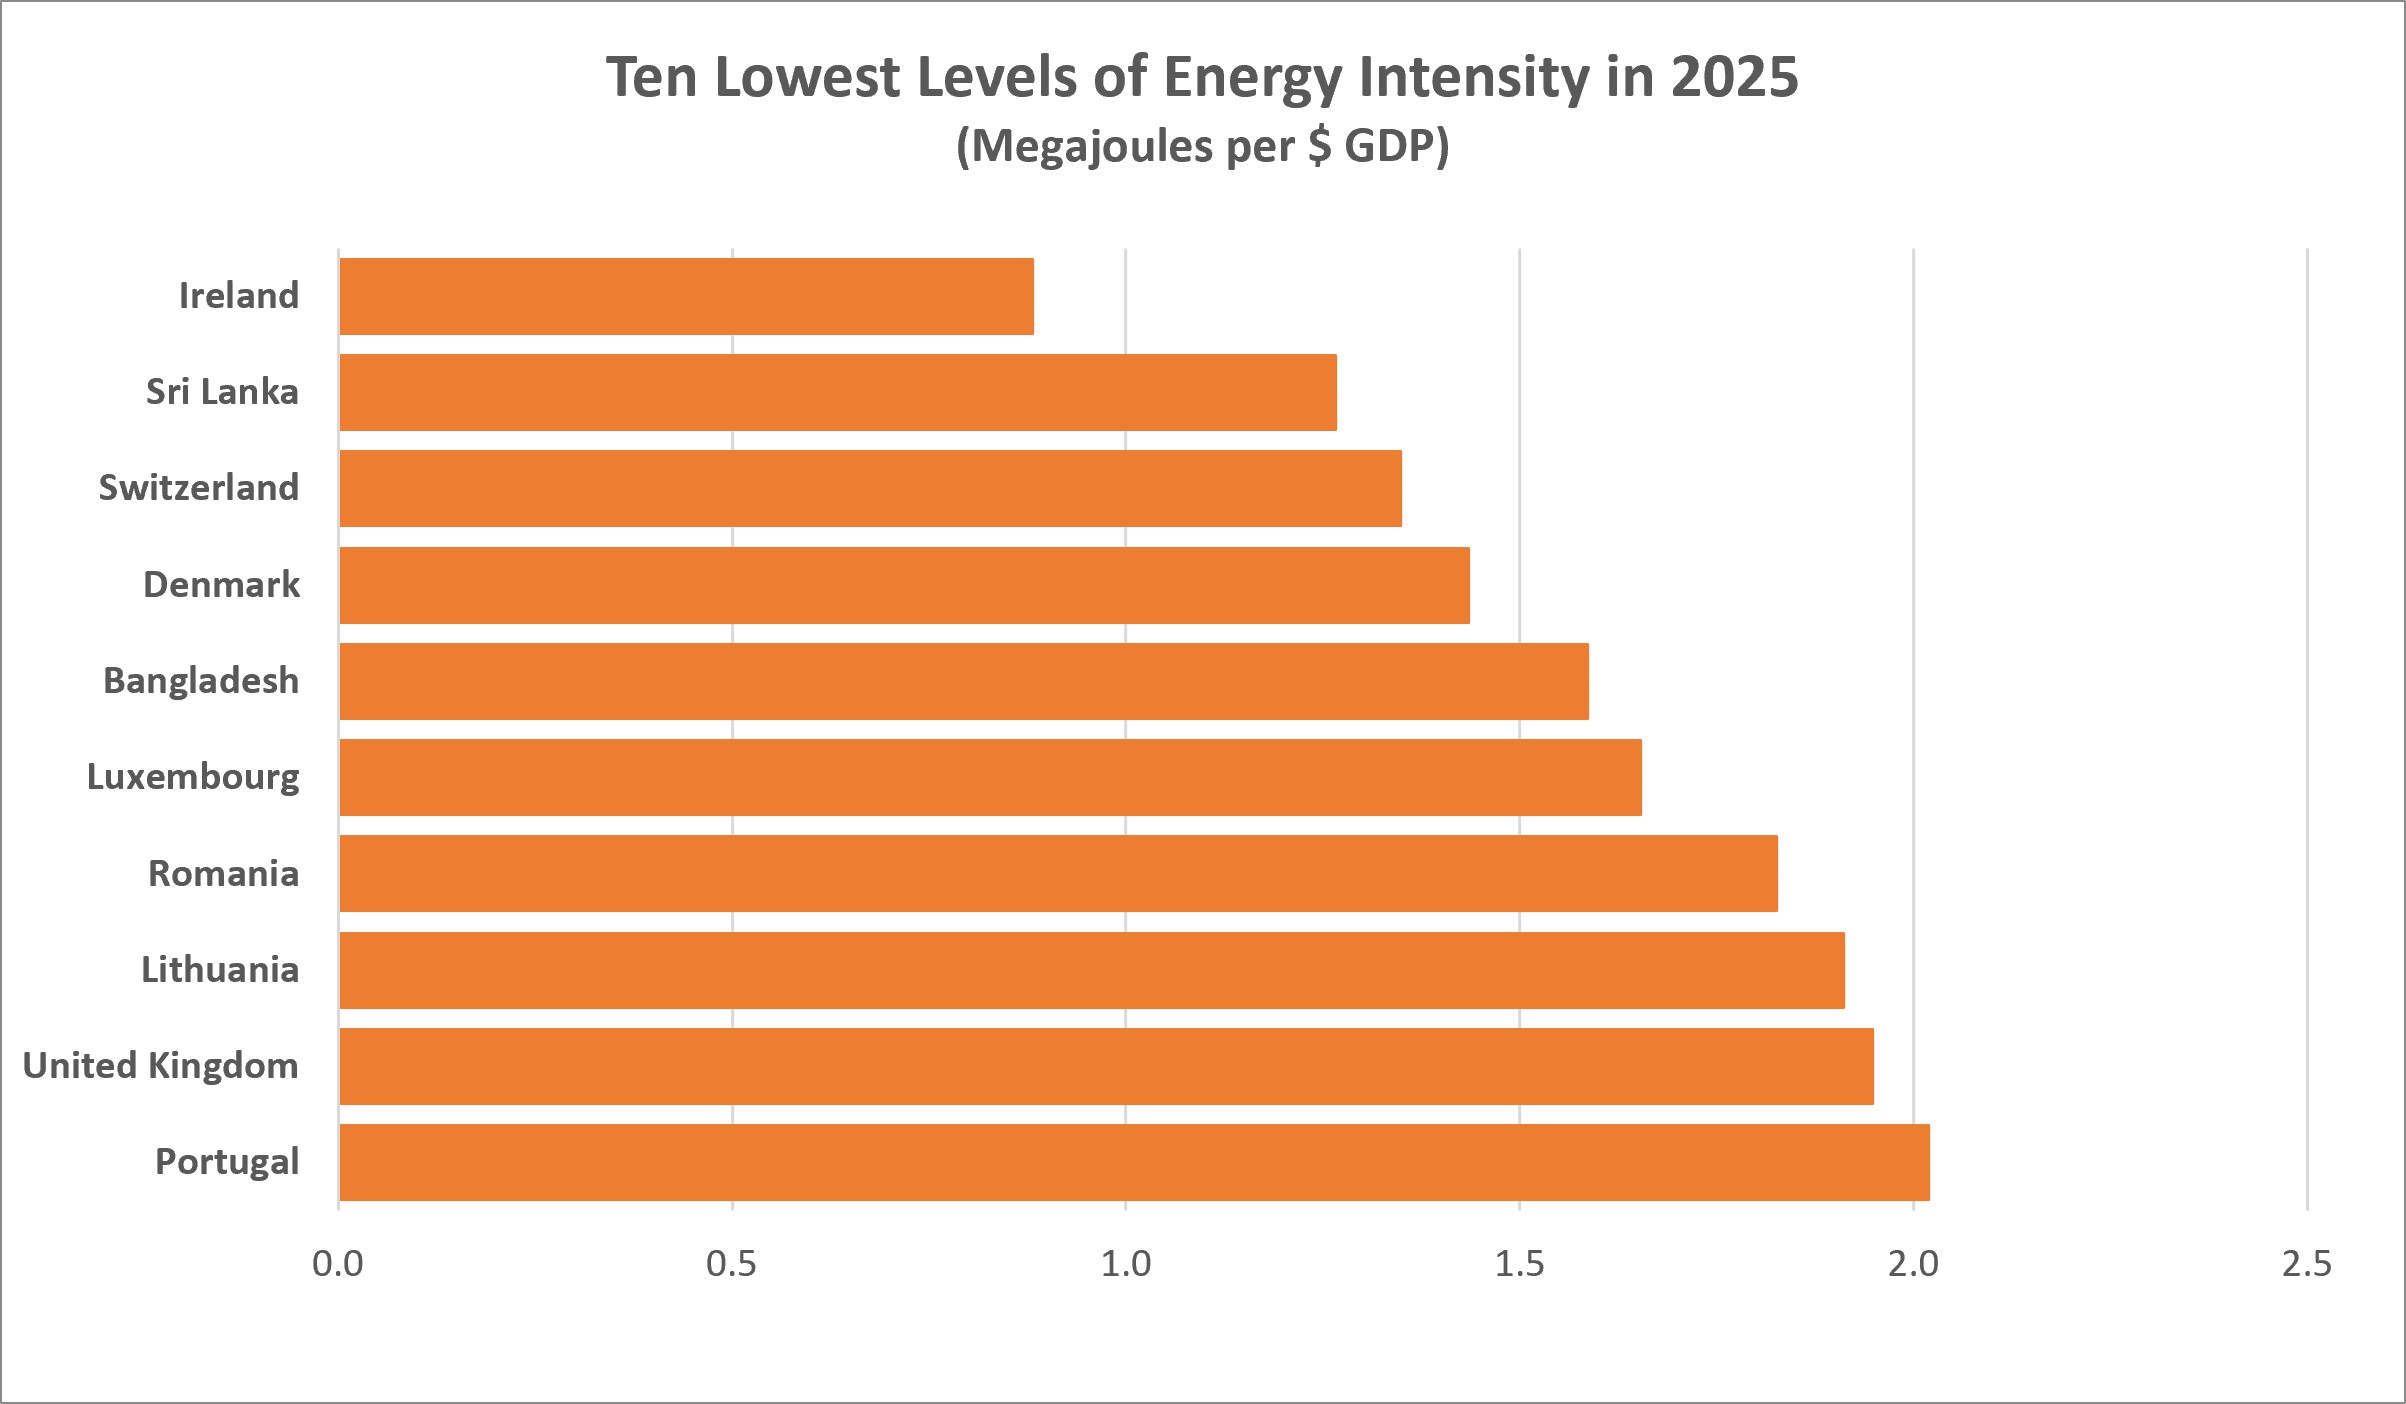
The ten least energy-intensive economies in 2025, in megajoules per dollar of GDP. Source: Energy Institute Statistical Review of World Energy Country Transition Tracker
Renewables are still a sliver
Renewable energy consumption, including hydroelectricity, increased in 74 of the 79 leading countries between 2017 and 2025. Globally it grew by more than 60% over the period, but it still met only around 8.6% of energy demand in 2025, the tracker found.
Global energy demand passed 600EJ for the first time in 2025, according to the Statistical Review, and renewables were the largest source of additional demand outside a recession. That growth has not been big enough to push fossil fuels out of the mix: the extra demand has been met by both.
Europe leads the rankings
Europe performs strongly across several of the tracker's measures. The UK, Spain, France and Germany rank among the top five performers on five or six of the eight metrics, while Italy and Brazil are top-five performers on four. Germany achieved the largest absolute cut in emissions, at 222mn tonnes of CO2-equivalent between 2017 and 2025.
The tracker's comparison of the 21 countries that consume the most energy shows the split clearly. The European countries are pale across most of the eight measures, while Indonesia and India are among the darkest on emissions and fossil fuel consumption, and Iran, Saudi Arabia, South Africa and the UAE score badly on renewables, power sector decarbonisation and carbon intensity. The UAE has the heaviest energy consumption per capita in the group.
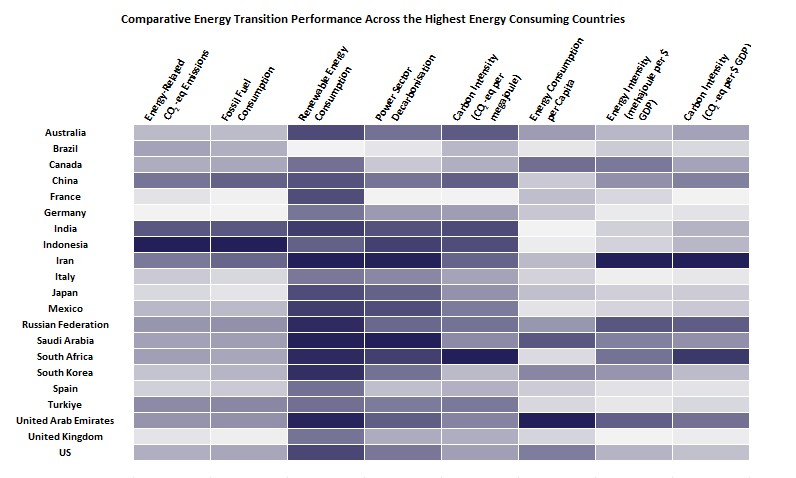
Comparative energy transition performance across the 21 highest energy-consuming countries on the tracker's eight measures; darker shading marks weaker performance. Source: Energy Institute Statistical Review of World Energy Country Transition Tracker
Power is far ahead of the rest
The power sector is much further along than the energy system as a whole. France has the most decarbonised power sector among the countries itemised, with 95% of generation coming from low- and zero-carbon sources, including 68% from nuclear. Brazil, which relies heavily on hydropower, comes second at 89%.
The big emitters keep growing
Some of the largest energy consumers continue to drive emissions growth. Between 2017 and 2025, China's energy-related emissions rose by 2,096mn tonnes and India's by 783mn tonnes. China's rise comes even though it is the world's green energy champion, building most of the world's new wind and solar capacity as it turns itself into an electrostate, because its overall demand has grown even faster.
The US alone was responsible for 36% of the increase in global energy-related greenhouse gas emissions in 2025 compared with 2024, the tracker found. Its coal consumption rose for the first time since the rebound in energy demand after the COVID-19 pandemic in 2021.
France alone in the target zone
The tracker plots the 21 biggest energy consumers, which account for around 80% of global energy demand, on two axes: economy-wide energy intensity and the share of low-carbon sources in total energy consumption, with the size of each bubble showing the change in its emissions since 2017. The target is the bottom right-hand quadrant, combining low energy intensity with a low-carbon share of more than half.
When all three measures are considered together, France is the only country in the target quadrant, with low-carbon sources, mostly nuclear, supplying just over half of its energy and an energy intensity of under 3 megajoules per dollar. Every other big consumer gets less than a quarter of its energy from low-carbon sources. China sits on the boundary of the high-intensity half at about 5 megajoules per dollar with a low-carbon share of around 10%, and its emissions bubble dwarfs every other country's. Iran is the most energy-intensive of the group at about 9 megajoules per dollar, with Russia and the UAE close behind, and all three increased their emissions over the period, as did India, Indonesia and Turkey.
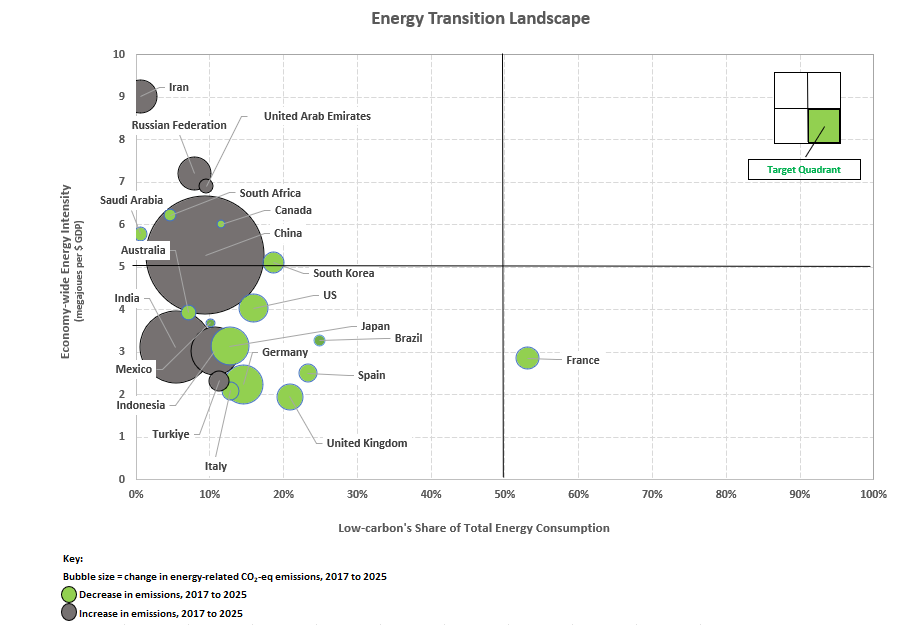
Energy intensity against low-carbon share of total energy consumption for the 21 highest energy-consuming countries; bubble size shows the change in energy-related CO2-equivalent emissions from 2017 to 2025, green for a fall and grey for a rise. Source: Energy Institute Statistical Review of World Energy Country Transition Tracker
"As governments gather at COP31, the data also underline the scale of the challenge still ahead. Global fossil fuel consumption and energy-related emissions have continued to rise since 2017. The transition will ultimately be judged not simply by how much clean energy we add, but by whether countries can meet growing demand for energy while driving emissions decisively down," Regniez said.
Follow us online